As discussed in a previous blog entry, style and substance go hand-in-hand when writing a good report. Now let’s discuss some simple methods you can use to write a report with style.
1. Use an appropriate font.
For written works, a font size of 11-12 is recommended. Anything below that will strain the reader's eyes. Digital reports have the advantage of being easily adjustable. Also consider the intended audience of your report and adjust accordingly. For example, older users might appreciate a more sizable text like font size 15.
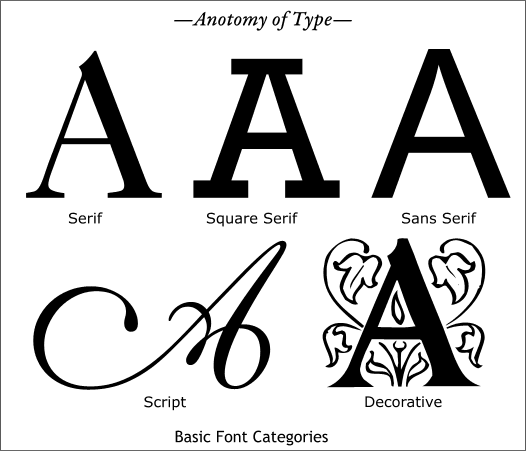
 Many font styles have been developed throughout the years, from the comical (and grossly misused) Comics Sans to the outdated Courier. Resist the urge to use ostentatious fonts and stick to reliable timeless ones such as Arial, Times New Roman, or Verdana. Some examples of stylish yet functional modern fonts include Calibri, Cambria, and Helvetica. Rather than examining the font style, readers should be breezing through the text.
2. Write crisp sentences and paragraphs.

Sentences must not be too long and overly complex. Start new sentences instead of adding a clause after clause. Your sentence is most likely too long when there are too many conjunctions (e.g. and, but, or) or commas.
Avoid making a 'wall of text' that spans the length of the page; instead break paragraphs into groups of logically-connected ideas. No one wants to read a report that like a stream-of-consciousness monologue. As a general rule of thumb, three to five well-constructed sentences make a good paragraph.
3. Eliminate spelling and grammatical errors.

With the advent of robust spell-check tools, there should be no excuse for submitting error-plagued reports. Make it a habit to use these tools before and after writing a report. Better yet, improve your English language fundamentals to avoid grammatical mistakes. Reading a few well-written articles in the newspaper everyday can gradually improve your English skills.
4. Add figures as needed to support the text.

Figures and images are used to support the text. Ensure that figures are able to do this by using a clear and systematic labeling format. The figure itself must be clear and concise enough to be understood at first glance. If your graph looks tedious because it is flooded with too many numbers and labels, simplify your graph.
Using a figure helps illustrate your point. If you are inserting a figure for any other reason, ask yourself what its purpose is and if it is truly necessary. More often than not, it isn't. Avoid adding figures just for the sake of adding figures.
5. Include supporting information.
For longer reports, include supporting pages such as a cover page, table of contents, executive summary, and appendix. Other additions include page numbers, footnotes, and endnotes.
Shorter reports can do without supporting pages. Instead, consider adding pertinent information such as titles and subtitles, author name and contact information, and date of submission.
by:TalkShop
No comments:
Post a Comment